|
Full Length Videos on Patreon:
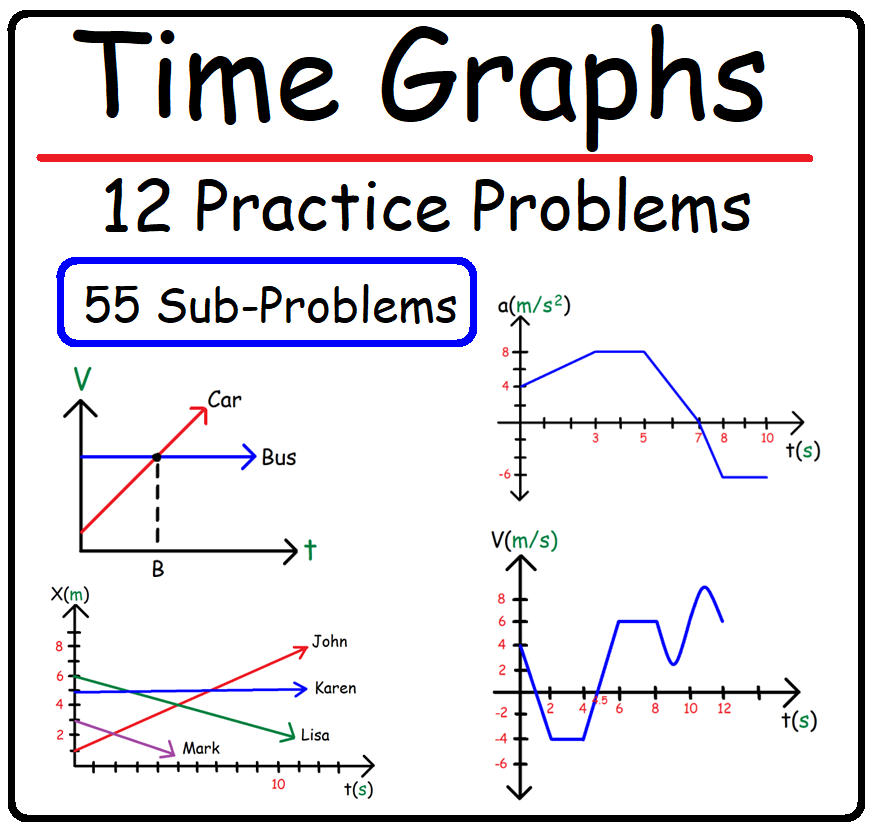
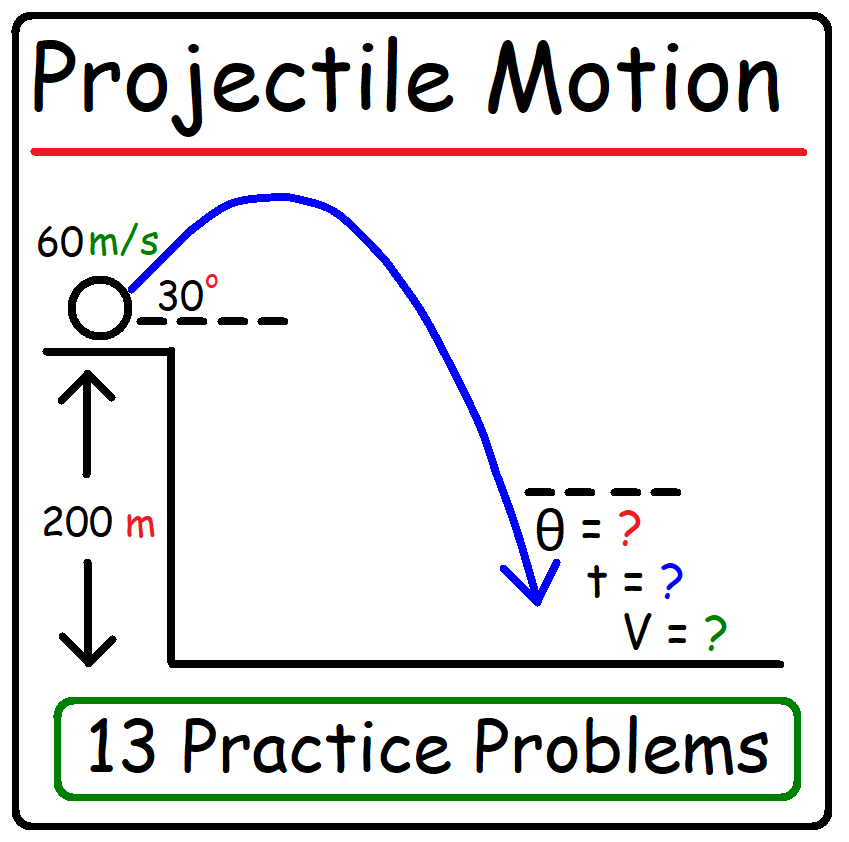
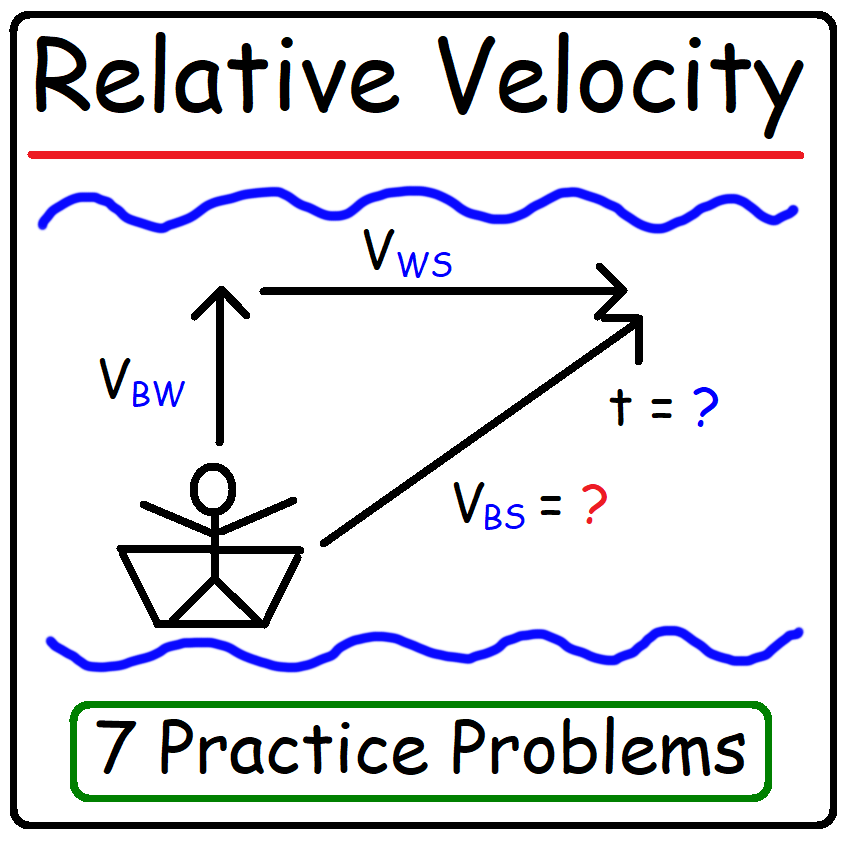
https://www.patreon.com/MathScienceTutor Direct Link to The Full 1 Hour 17 Minute Video - Part 1: https://bit.ly/3XneJ9x Direct Link to The Full 1 Hour 19 Minute Video - Part 2: https://bit.ly/3Cj1aQf PDF Worksheet - 55 Sub-Problems: https://bit.ly/3vDZT2s Important Rules to Know For Motion-Time Graphs! Position-Time Graphs: 1. The slope of the tangent line on a point (x = a) on the position-time graph is equal to the instantaneous velocity. 2. The slope of the secant line connecting two points (x = a and x = b) on the position-time graph is equal to the average velocity of the particle on the interval [a, b]. 3. The area under the curve of a position-time graph does not have any significant meaning. 4. The velocity is positive when the position function is increasing and its negative when the position function is decreasing. The velocity is zero on the intervals where the position function is constant. Velocity-Time Graphs: 1. The slope of the tangent line on a point (x = a) on the velocity-time graph is equal to the instantaneous acceleration. 2. The slope of the secant line connecting two points (x = a and x = b) on the velocity-time graph is equal to the average acceleration of the particle on the interval [a, b]. 3. The area under the curve of a velocity-time graph is equal to the displacement of the particle. The Displacement is equal to the change in position. Displacement can be equal to the distance traveled by a particle if the particle does not change direction during the time period under consideration. 4. The particle is moving to the right when the velocity is positive and its moving to the left when the velocity is negative. If the velocity is equal to zero, the particle is either at rest or it's changing direction. 5. The acceleration is positive when the velocity function is increasing and its negative when the velocity function is decreasing. The acceleration is zero on the intervals where the velocity function is constant. Acceleration-Time Graphs: 1. The slope of the acceleration-time graph is equivalent to jerk/jolt. 2. The area under the curve of an acceleration-time graph is equal to the change in the velocity of the particle. 3. The velocity is increasing on the intervals where the acceleration function is positive or above the x-axis. The velocity is decreasing on the intervals where the acceleration function is negative or below the x-axis. The velocity is constant when the acceleration function is zero or when it touches the x-axis. Distance, Displacement, Average Speed, & Average Velocity: https://www.video-tutor.net/distance-and-displacement.html Kinematics In One Dimension: https://www.video-tutor.net/kinematics-one-dimension.html Free Fall Physics Problems: www.video-tutor.net/free-fall-equations.html Vectors - Basic Introduction: www.video-tutor.net/vectors-basic-introduction.html Projectile Motion Physics Problems: www.video-tutor.net/projectile-motion-problems.html Video Playlists and Final Exam Videos: www.video-tutor.net/ |
